
By using a simple mathematical formula, the moving average calculates a security’s mean price reflected over a specified period of time or “look-back period.”
Moving averages are used consistently by traders to perform technical analysis to refine price data, understand market trends, as well as develop support and resistance for making trade decisions. A rising moving average tends to reflect a bullish upswing. Conversely, a declining moving average will reflect a bearish downswing.
There are various moving average intervals that are commonly used among analysts. Long-term traders typically utilize the 50, 100, and 200 day look-back periods whereas shorter-term traders use 10, 12 and 26 day look-back periods. However, due to the simple nature of moving averages, short look-back periods reflect more volatility. Longer look-back periods will be smoother, but not take into account the impact of more recent market trends.
Three common moving averages are the Simple Moving Average (SMA), the Exponential Moving Average (EMA), and the Moving Average Convergence-Divergence (MACD). The SMA will place equal weight on each day’s price, whereas EMAs place exponential weight on the most recent price changes. The MACD will compare two moving averages, typically two Periods from EMA or SMA.
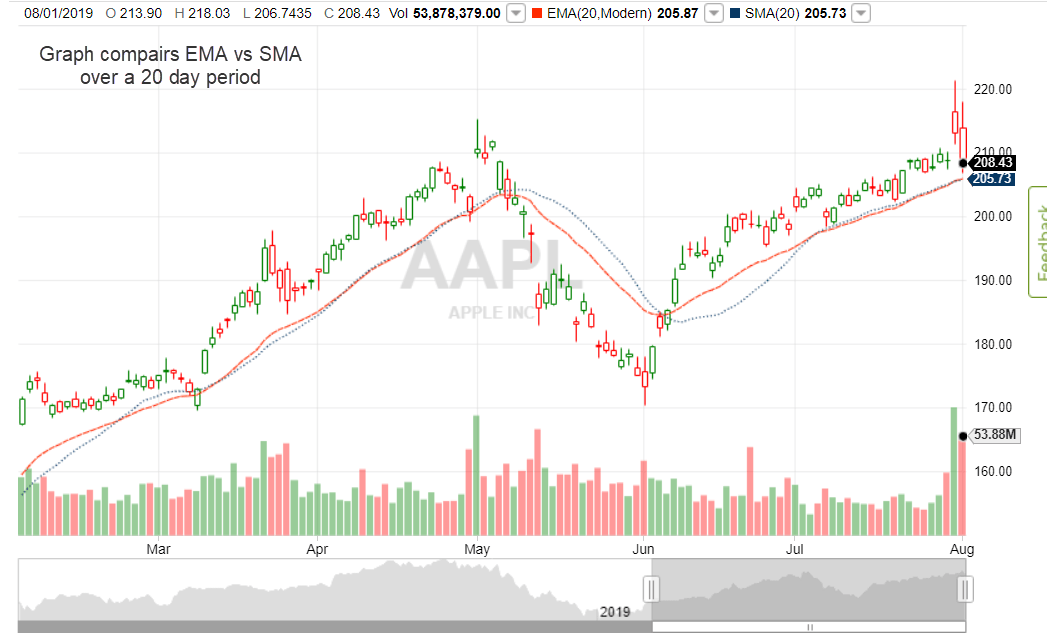
Example: 20 Day Look-Back Period for EMA & SMA Over 6 Months
Pros & Cons of Moving Averages
One drawback of utilizing moving averages is that when prices trigger the signal line, they may only be temporary reversals or false breakouts. The speed of EMA crossovers can indicate that a security’s market has been overbought or sold. These false breakouts in market trends can result in a loss if the trader is unprepared. Another con of the moving average is the use of historical data, which means the indicator tends to lag the real time movement of the market.
On the contrary Moving averages help smoothen out the chaotic price fluctuations in the market and provide a clean visual reference of the trends. Additionally, the SMA and EMA help identify trends and when potential reversals may occur. In some cases the moving averages may guide your entry and exit price points.
Let us turn our change direction and take a look at a couple commonly used moving averages: SMA, EMA, and MACD.
The Simple Moving Average (SMA)
The Simple Moving Average (SMA) is used as the starting point of the range of prices used to calculate the SMA value. We can calculate the SMA by summing the number of time periods included in the look-back period and divide by a multiplier that depicts the moving average indicator’s curve.
With any average, the look-back period utilized is up to the trader’s discretion: 10 days, 5 minutes, 40 weeks, etc. Some commonly used time periods for SMA analysis are 10, 20, 50, and 100 days. Many trading platforms come equipped with charting software that does these calculations for the trader. Here is a quick breakdown of the SMA formula and simple example.
SMA = “X” day period sum / “X” | where “X” equals the time period.
Example: 3 Day SMA
- Closing Prices for the Last 5 days: 4, 5, 6, 7, 8, 5
- Day One of 3 Day SMA: (4+5+6)/3 = 5
- Day Two of 3 Day SMA: (5+6+7)/3 = 6
The Exponential Moving Average (EMA)
The EMA calculation is far more in-depth then the SMA calculation. The EMA computation utilizes the prior days EMAs’ to generate our average. To start we need to begin by calculating the SMA for the period we wish to use. Next, we calculate a multiplier used to ‘weight’ our average. This weighing multiplier is why we see the EMA influenced more by recent events. The final part of the calculation is determining the average of the EMA’s across our time period.
Example: 20 Day EMA
- Initial SMA: 20 Day Sum / 20
- Multiplier: (2 / (Time Periods + 1)
- Calculate Multiplier: (2 / (20 + 1) = 0.0952 (9.52%)
- EMA = {Closing Price – EMA(Previous Day)} x Multiplier + EMA(Previous Day)
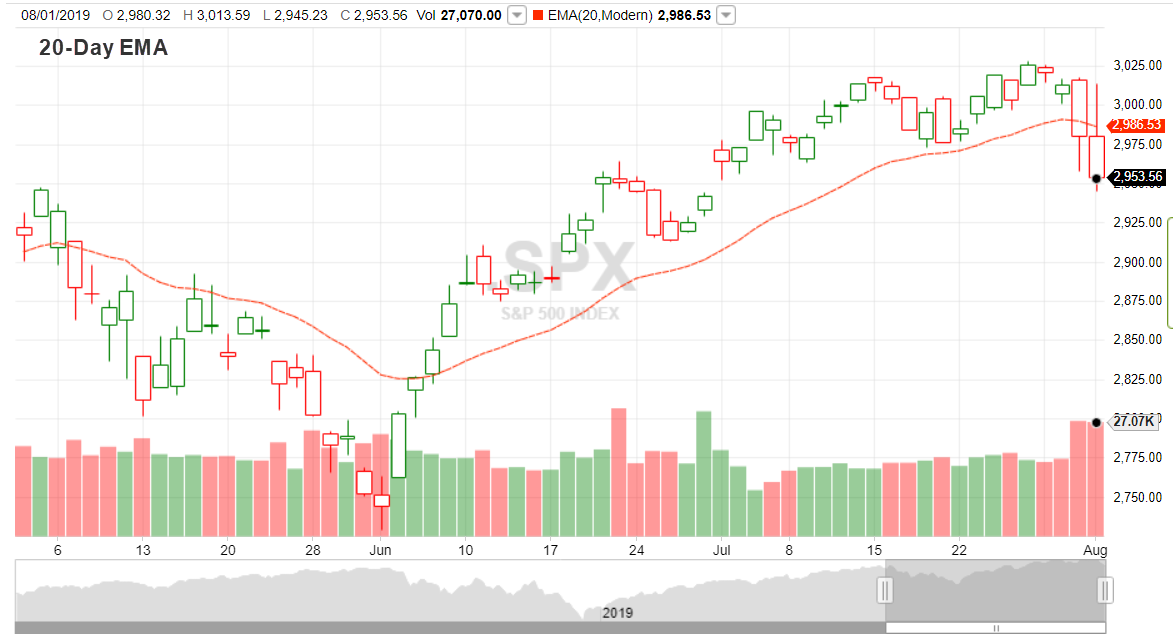
Example: 20 Day EMA Across a 6-Month Period for the S&P 500 Index
The MACD - Moving Average Convergence Divergence
The MACD Strategy is use to identify market upward or downward trends and provide support or resistance to trading within them by comparing the crossover of two different EMAs. The MACD is calculated by utilizing what is called an EMA Crossover Strategy by subtracting a 26-day look-back EMA from a 12-day look-back EMA.
Uptrends in the market will occur when the 12-day price trades above or crosses the 26-day moving average and generates a positive value. This bullish movement means that the security’s price has risen enough to flag the signal line to indicate that a potential buy could be placed.
Downtrends occur when the price trades below the moving average and generate a negative value. Trading below the short-term moving average results in lower prices. This tends to be viewed as a bearish trend.
The information provided in the WCA Education Center does not, and is not intended to, constitute financial advice and all information, content, and materials available in the WCA Education Center are for general informational purposes only. This information may not constitute the most up-to-date information. The WCA Education Center may contain information from or links to other third-party websites. Such links are only for the convenience of the reader, user or browser; World Cup Advisor and its affiliates do not recommend or endorse the contents of any third-party sites.
Trading futures and forex involves significant risk of loss and is not suitable for everyone. Past performance is not necessarily indicative of future results.

